50% of your emissions are hiding in the bin.

Stream-level data on the scope 3 emissions you've been guessing at.

A person putting a takeaway cup in a waste bin with 2 graphics with CO2e emissions and landfill diversion rate.
Trusted by professionals from
The National Grid logo.The Suma Coop logo.The DHL logo.

How it works

Stream-level data, science-based reduction.

A box of electrical waste with 2 graphics attached: "Product is Recyclable in: 4.5M", "Recovery Rate at MRF: 56%".

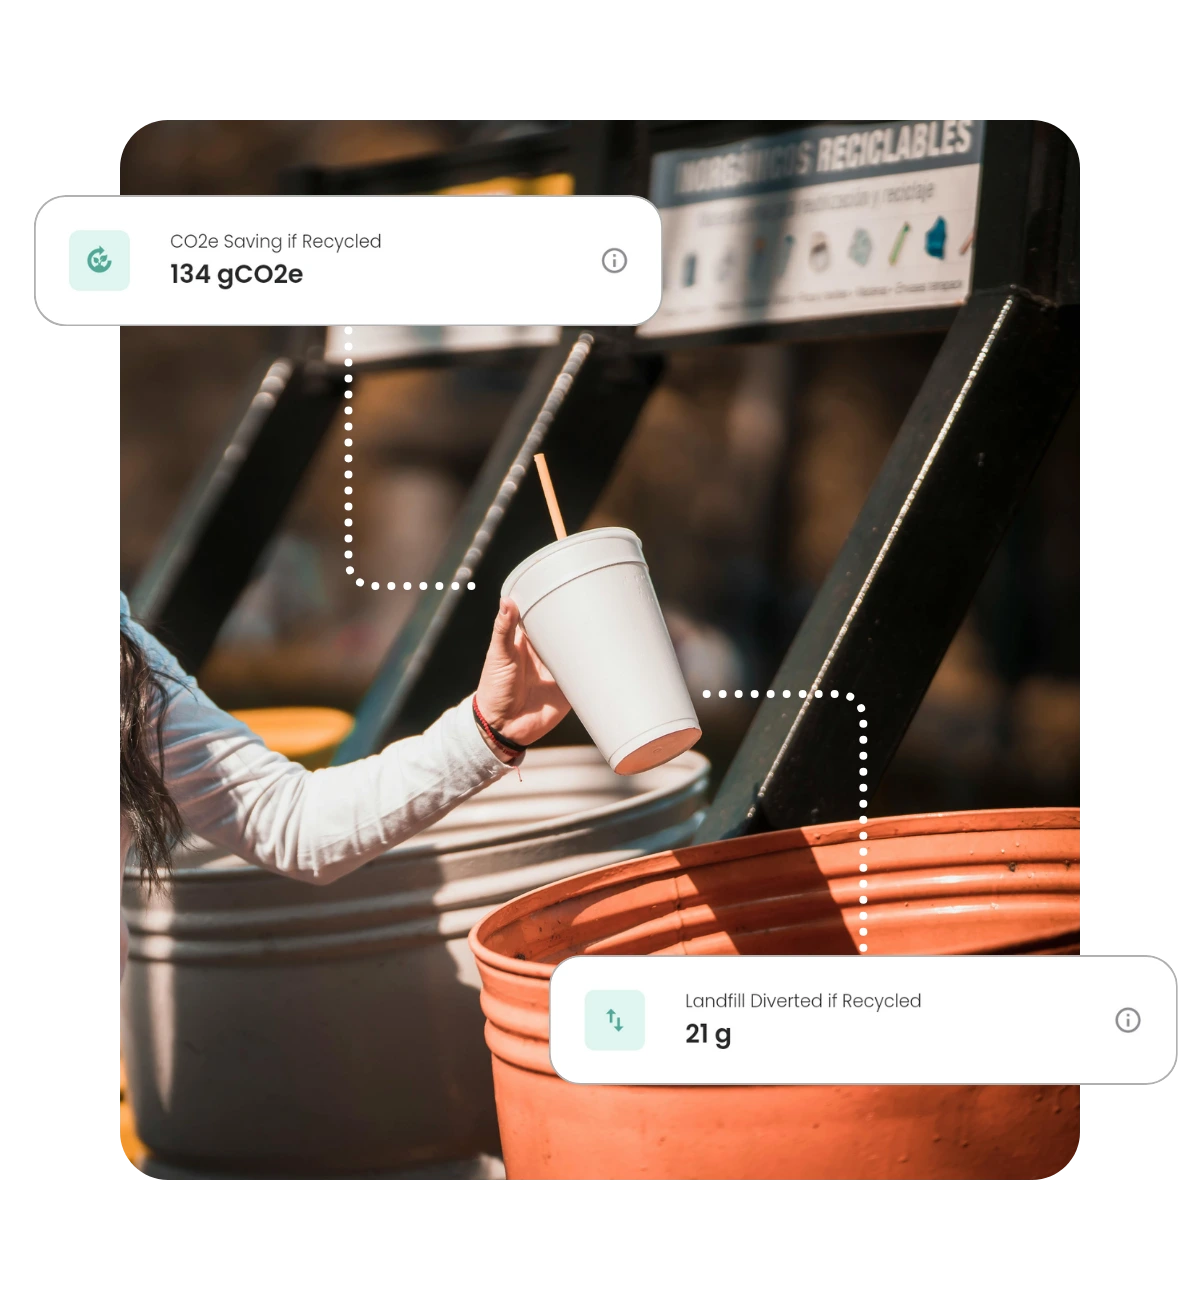
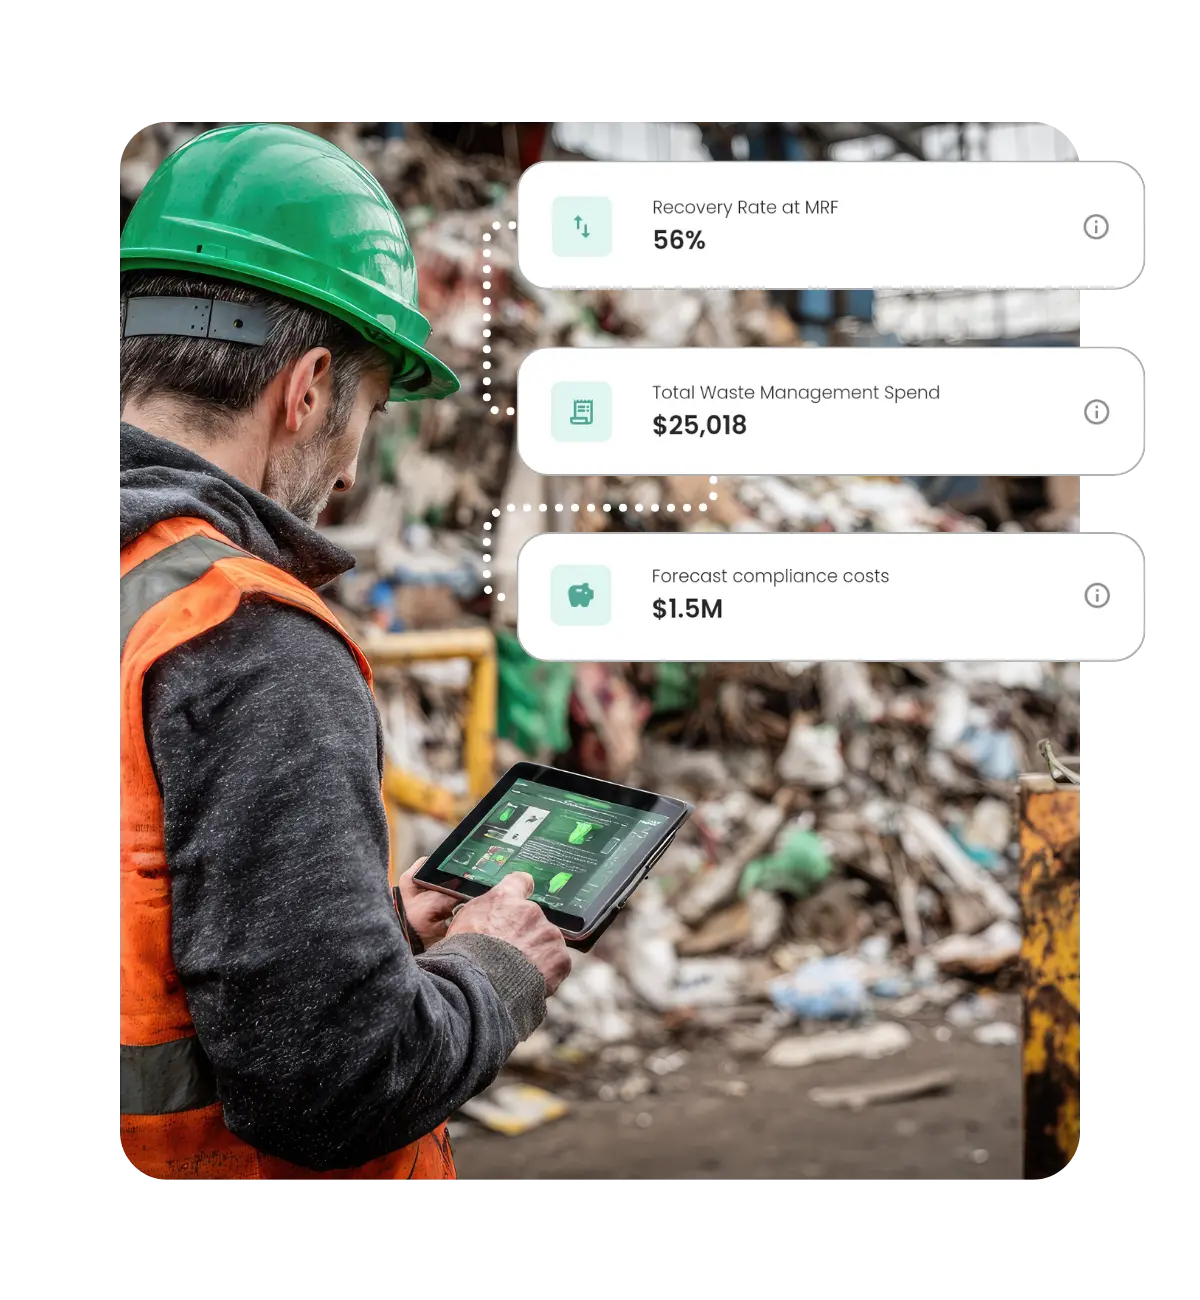
Step 1 · Measurement — Scope 3 waste emissions across operations

Qualified team measures your scope 3 waste emissions.

Across every site, every stream — not the desk-research version, the version backed by what's actually in your bins.

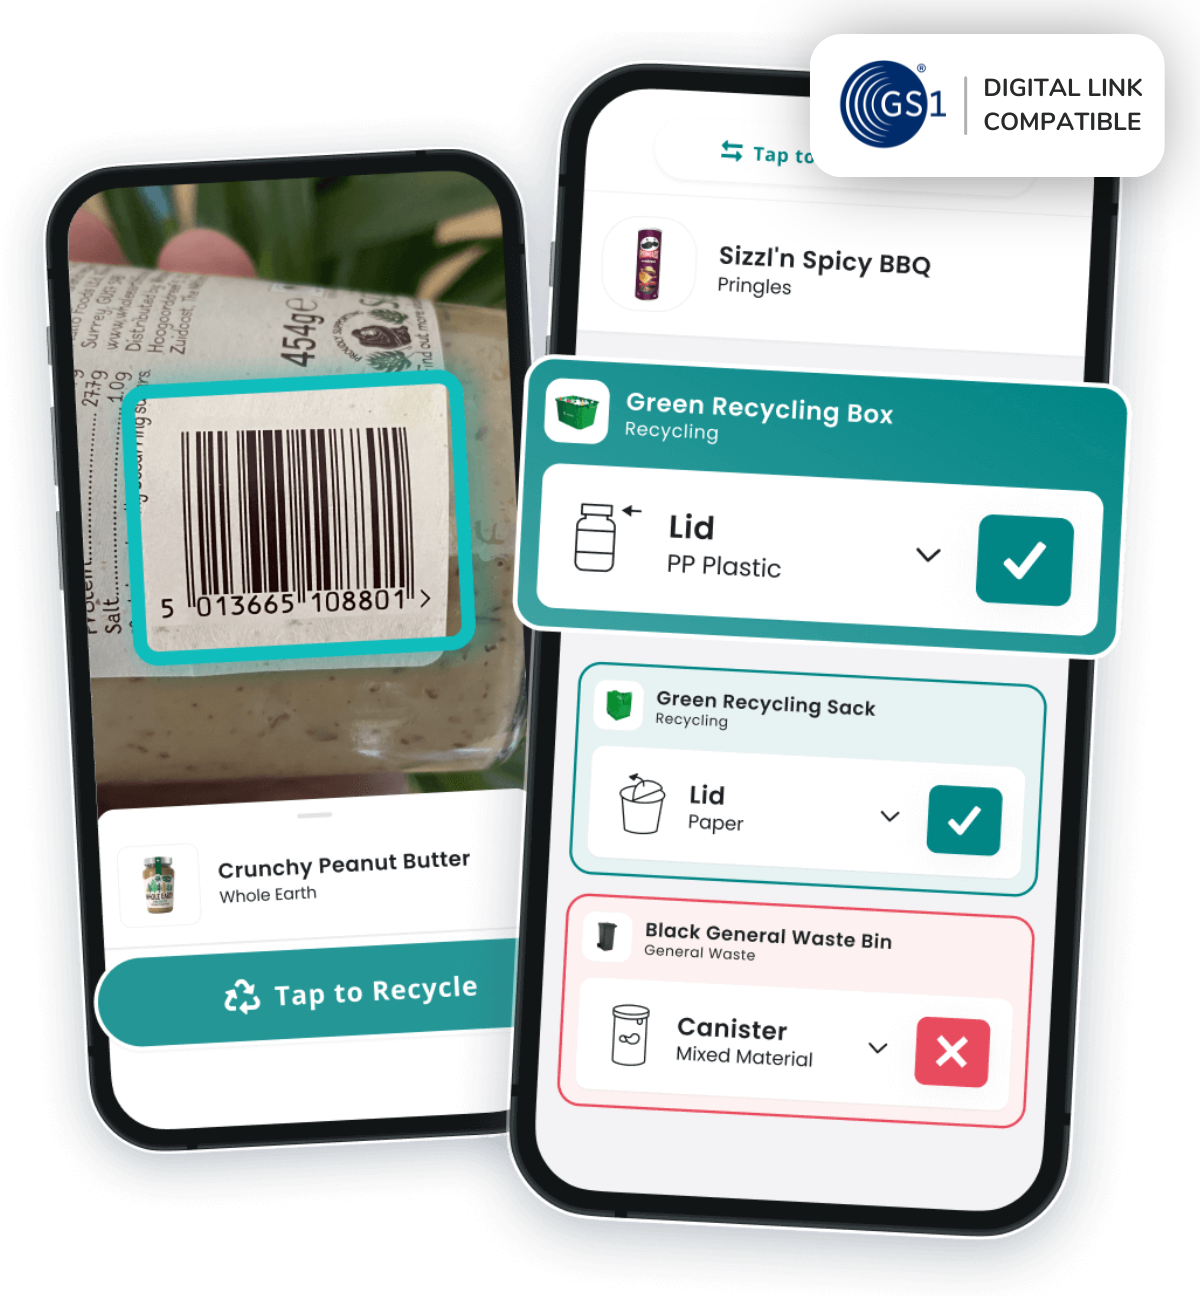
Step 2 · Stream-level data — Contamination, behaviour, participation

Our software gives you stream-level emissions data with no generalizations.

Contamination, behavior change, participation — measured continuously, attributed to streams and sites.

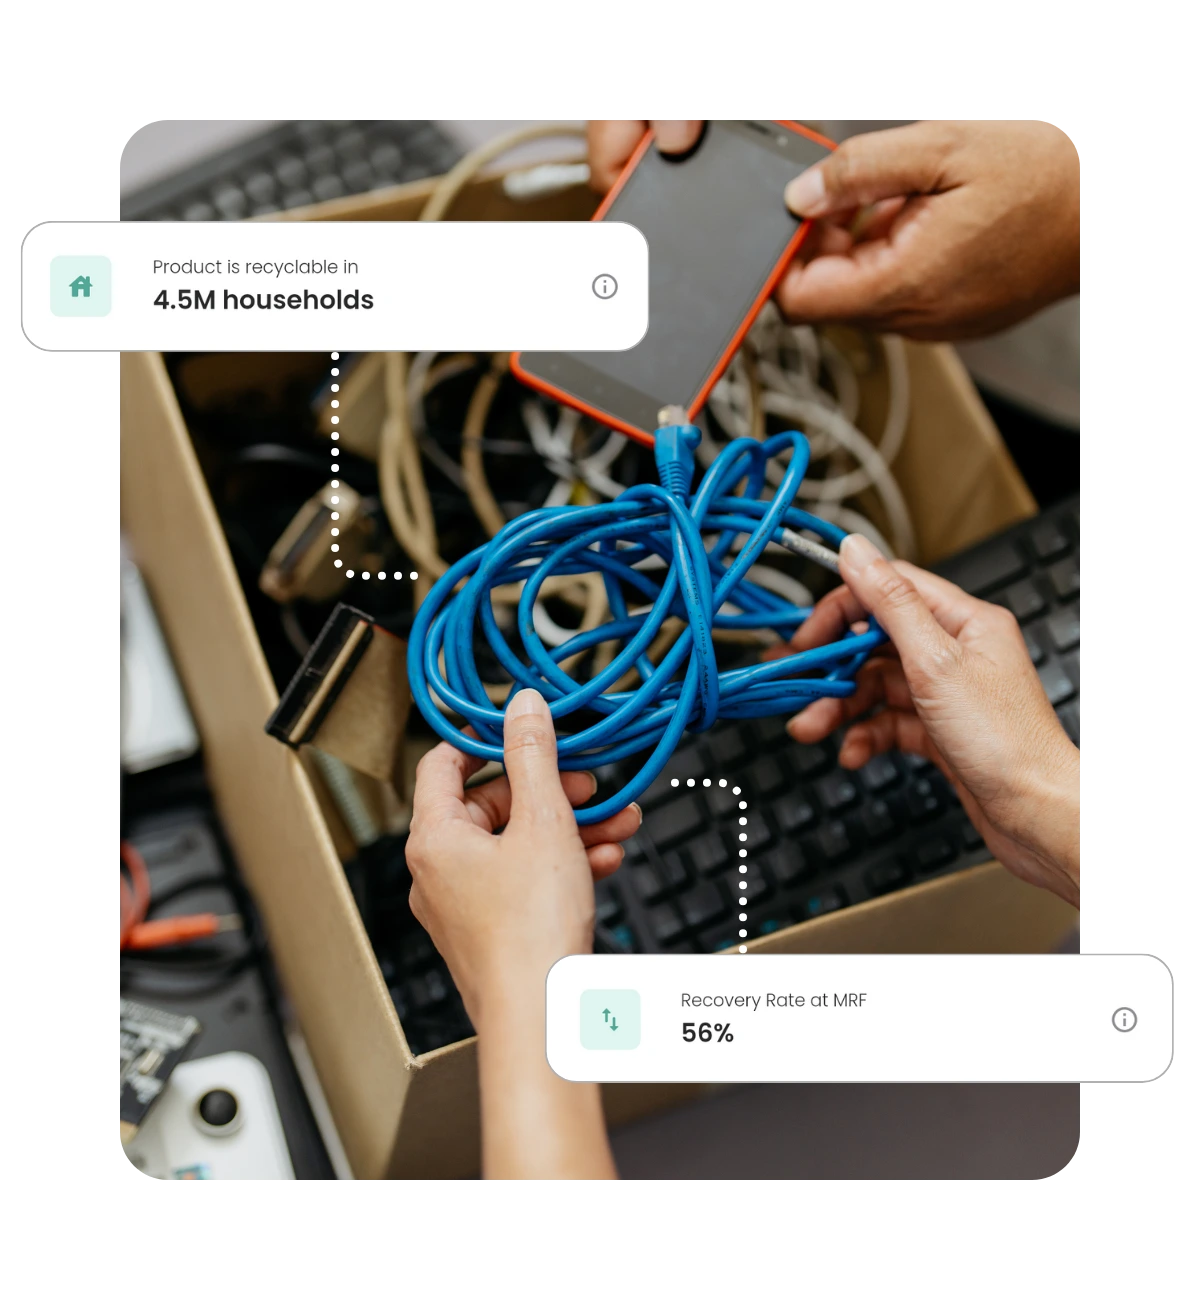
Step 3 · Reduction roadmap — Tied to science-based targets

Certified support team builds a reduction roadmap.

We tie your data to your science-based targets and surface the highest-leverage interventions — not the easy wins, the real ones.

outcome · save time

Account for the emissions from your waste streams.

"We're reporting scope 1 and 2 confidently. Scope 3 is a guess."

Verified data on every reported ton →
A woman sat at an office desk talking emphatically, with 2 graphics behind her from Scrapp's web portal. The first graphic shows the breakdown of materials including Metal, Paper & Card, Glass, Composite and Organic with varying percentages on it. The second graphic shows "Landfill Diverted = 28,391 kg".
A person putting a takeaway cup in a waste bin with 2 graphics with CO2e emissions and landfill diversion rate.

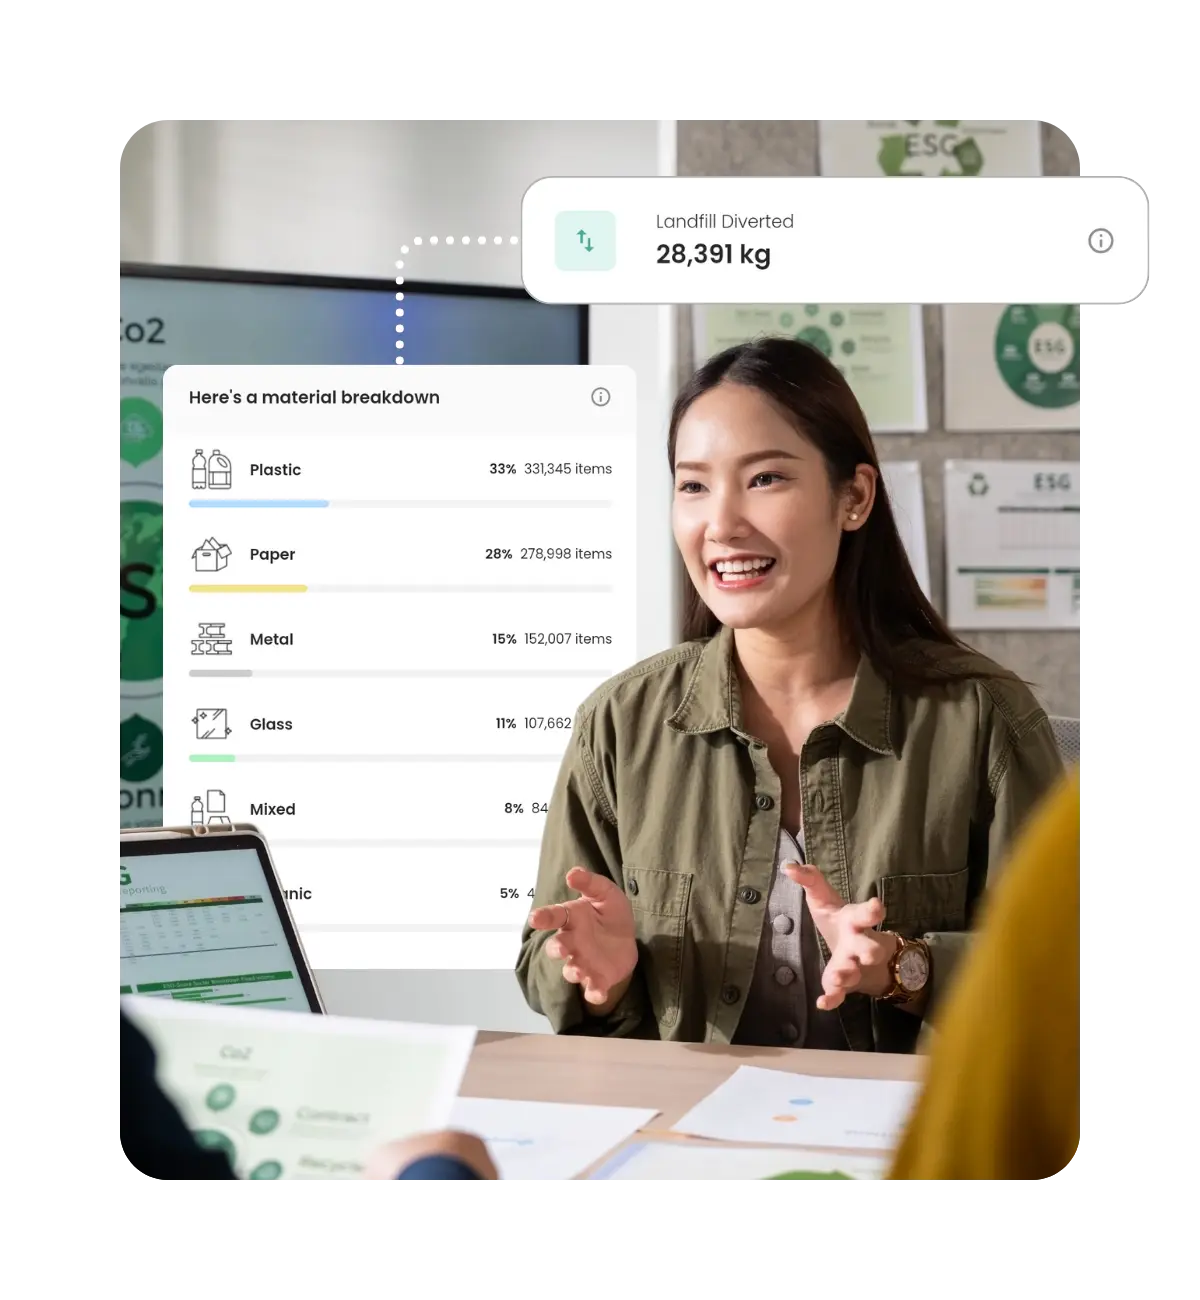
feature · automated emissions calculations

Scope 3 waste emissions accounting

Stream-level emissions calculations grounded in your actual waste data — not industry averages. Built around the GHG Protocol Category 5 (Waste Generated in Operations) methodology and audit-ready out of the box.

Get a free recycling app for your teams

Give your teams the tools to go zero-waste - at work or at home

Get started today →
Screenshots of the Scrapp mobile app on phone showing product scanning and recycling guidance features, with GS1 Digital Link Compatible badge

outcome · reduce impact

Reduce contamination — the biggest hidden emission source.

"Our recycling rate looks great until you account for what's actually contaminated."

88% increase in recycling participation →
An overflowing garbage bin with 2 graphics attached to it: "Contamination Rate: 42%" and "Bin fullness at collection: 125%".
A man at a waste and recycling center holding an iPad with 3 metrics attached to him: "Recovery Rate at MRF: 56%", "Total Waste Management Spend: $25,018", and "Forecast Compliance Costs: $1.5M".

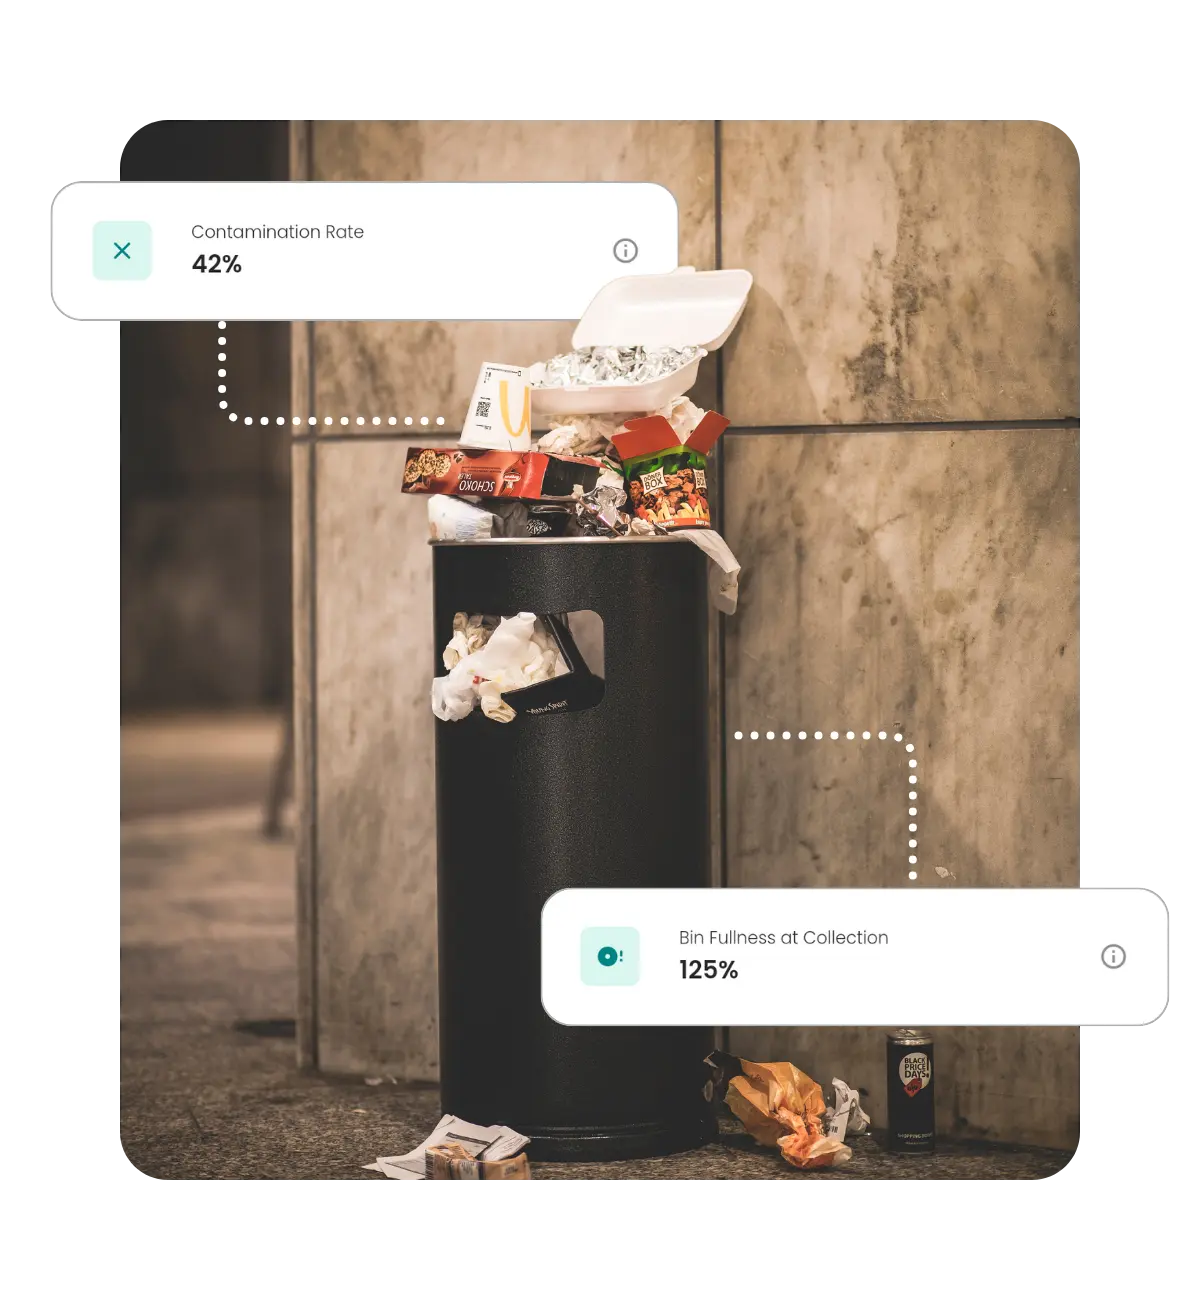
feature · automated data categorization

Waste reports with evidence

Organized and clean waste data with trend analytics — saving time chasing departments for metrics when you have it in one spot.

Ready to design with impact data in the room?

Send us a current SKU. We'll score it and show you the swap that lifts it most.

Score my SKU