.webp)
The quick answer: best supply chain environmental tracking tools in 2026
Supply chain environmental tracking in 2026 requires digital platforms that collect real-time data, automate reporting, and give you visibility across every tier of your operations. The best tools integrate with existing systems and show you exactly where your environmental impact sits — whether that's emissions, waste, water use, biodiversity impact or energy consumption.
Organizations chasing genuine zero-waste goals use platforms that go beyond compliance. They drive behavioral change and deliver measurable improvements. The most successful implementations share common traits: executive commitment, cross-functional teams, and clear metrics tied to business outcomes. Organizations typically achieve 15–30% reductions in environmental impact within the first two years. Investment ranges from $50,000 for small businesses using specialized tools to several million for enterprise-wide deployments across global supply chains.
What is supply chain environmental impact tracking?
Supply chain environmental impact tracking is the systematic measurement, monitoring, and management of environmental effects generated throughout a product's journey — from sourcing through disposal. In 2026, this practice has evolved from a voluntary corporate responsibility initiative to a regulatory requirement and competitive necessity. You can learn more about environmental management through one of our previous articles.
Regulatory frameworks like the EU's Corporate Sustainability Reporting Directive (CSRD) now mandate detailed environmental disclosures. Over $40 trillion in assets under management now incorporate sustainability criteria. Consumers are paying attention too — studies show that 73% are willing to pay a premium for demonstrably sustainable products.
The fundamental challenge is this: roughly 80–90% of a company's environmental footprint sits within its supply chain — areas it doesn't directly control. Effective tracking creates the visibility needed to identify hotspots, engage suppliers, and prove progress against commitments. Without accurate tooling, you can't manage what you can't measure.
The five pillars of environmental impact: what actually gets measured
Not all environmental impact is created equal — and not all of it gets tracked with the same rigor. Understanding the distinct categories of environmental data is essential for choosing the right tools and focusing your efforts where they'll count.
Carbon emissions (Scope 1, 2, and 3)
Carbon accounting is often the first metric organizations tackle, because regulatory pressure makes it impossible to ignore. The greenhouse gas (GHG) protocol divides emissions into three scopes. Scope 1 covers direct emissions from sources you own or control — think fuel burned in your fleet or on-site boilers. Scope 2 covers indirect emissions from purchased electricity, heating, and cooling. Scope 3 is everything else across your value chain, both upstream and downstream.
The problem is Scope 3 emissions typically represent around 90% of a company's total footprint, yet they're the hardest to measure because they sit outside an organization's direct control. Carbon accounting platforms need to handle location-based and market-based methodologies, apply recognized emission factors, and allocate shared emissions across products and business units.
Waste and circularity
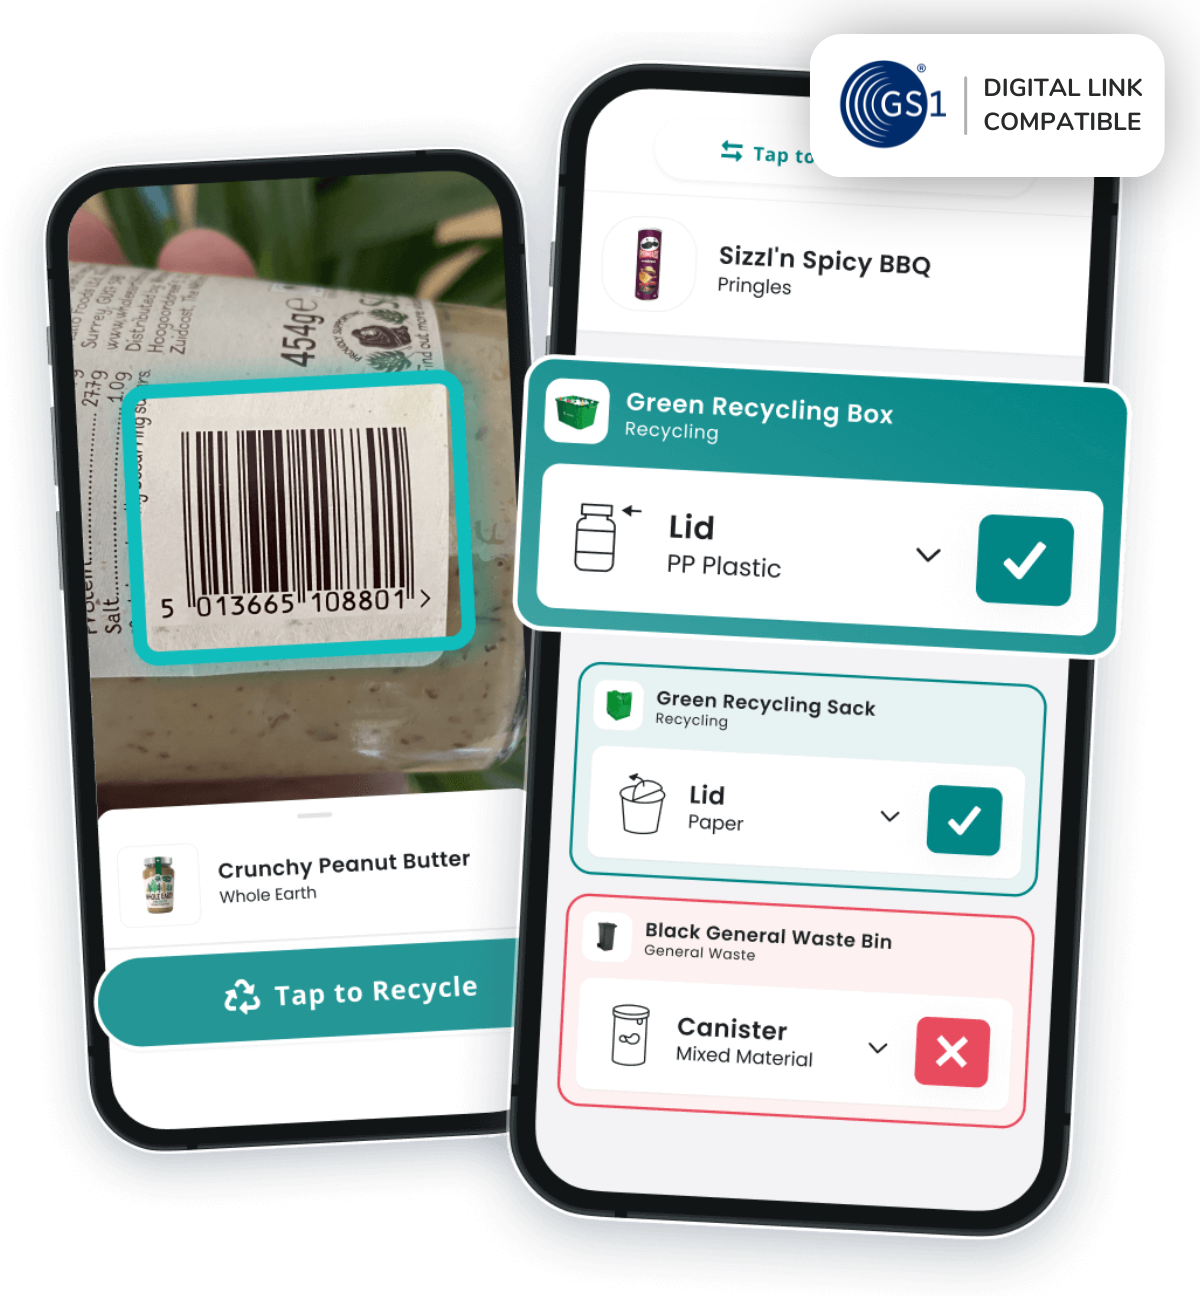
Waste data tracks what gets generated, where it goes, and how much gets diverted from landfill. For organizations pursuing zero-waste goals, this means monitoring waste streams at each stage of the supply chain, tracking diversion rates, identifying recycling and composting opportunities, and measuring circular economy metrics like material recovery rates. Waste invoices and receipts are typically inaccurate or outdated, leaving waste data in a black box that makes it hard to derive meaningful insights.
This is the space where granular, item-level visibility makes the biggest difference. It's not enough to know you produced 10 tons of waste last quarter. You need to know what type, from which process, what was recyclable, and what actually got recycled. Platforms built specifically for waste accounting — like Scrapp — provide this depth, combining data collection with communication tools that drive behavioral change across your teams and communities. We've written about how communication strategies boost proper disposal rates — it's an often-overlooked piece of the puzzle.
Water consumption
Water is the environmental metric that often flies under the radar, yet it accounts for roughly 39% of total environmental impact when measured against other factors like emissions and waste. Industries with heavy water footprints — agriculture, food processing, textiles, energy production, data centers — face growing scrutiny as freshwater scarcity intensifies globally.
Tracking water consumption means measuring intake, discharge quality, and the efficiency of water use across operations. In some industries, like oil and gas, an oil field typically generates about three barrels of produced water for every barrel of oil. Getting visibility on this data is critical for regulatory compliance and risk management.
Energy consumption
Energy use underpins nearly every other environmental metric. It's the fuel behind your carbon emissions and often the driver of water consumption (power plants are thirsty operations). Tracking energy means measuring consumption across facilities, identifying inefficiency, and understanding the split between renewable and non-renewable sources.
For many businesses, energy tracking is the most mature environmental metric — largely because the financial incentive is so direct. Every kilowatt-hour saved shows up on the balance sheet immediately.
Biodiversity and nature impact
Biodiversity is the newest — and arguably the most complex — pillar of environmental tracking. Where carbon can be reduced to tons of CO2e and waste measured in kilograms diverted, biodiversity involves interconnected ecosystems that don't fit neatly into a spreadsheet.
That said, it's becoming impossible to ignore. The Taskforce on Nature-related Financial Disclosures (TNFD) is accelerating adoption fast — over 760 companies had voluntarily adopted the TNFD framework by November 2025, and the EU's CSRD now requires biodiversity impact disclosures. For organizations with land-intensive supply chains — agriculture, food and beverage, construction, extractives — biodiversity tracking is moving from "nice-to-have" to "need-to-have."
Emerging tools use everything from satellite imagery and eDNA sampling to AI-powered bioacoustics (listening to birdsong to measure ecosystem health) to provide scalable, science-based biodiversity data. The technology is still maturing, but the direction is clear: nature is the next frontier of environmental accountability.
Why different industries need different strategies
Here's what most "best environmental tracking software" lists won't tell you: the platform you need depends on where your biggest environmental impact sits. And that varies by industry.
Not every sector has the same problem
For airlines, the environmental story is dominated by fuel. Scope 1 emissions from jet fuel account for the vast majority of an airline's carbon footprint, with 99% of those being CO2 from combustion. If you're an airline sustainability lead, your priority is carbon accounting and fuel efficiency — not recycling better in the break room. You need a platform built for emissions modeling, SAF (sustainable aviation fuel) tracking, and fleet-level carbon intensity metrics.
For food and beverage companies, it's a different picture entirely. Food waste accounts for 8–10% of global greenhouse gas emissions, and water usage in food production is one of the largest single environmental impacts across any industry. A food company's tracking platform needs to handle waste diversion at scale, water discharge quality, and the complexity of perishable supply chains.
For a manufacturing business or an office portfolio, waste and circularity are often the biggest levers available. How much material goes to landfill? What contamination rates are you seeing? Where could you redesign procurement to reduce downstream waste? These are questions that carbon-first platforms aren't designed to answer — but waste-specific tools are.
For the construction sector, the priority shifts again toward embodied carbon in building materials and life cycle assessment. A commercial real estate team might care most about energy efficiency and operational waste across a portfolio of buildings.
For agriculture and food supply chains, biodiversity is fast becoming the lead metric. Farms depend directly on ecosystem services like pollination, soil health, and water quality. With the TNFD framework gaining regulatory teeth and buyers demanding evidence of nature-positive practices, land managers need biodiversity monitoring tools alongside their carbon and water data.
The takeaway: match the tool to the problem
The point isn't that any of these metrics don't matter. Every organization should eventually track emissions, waste, water, energy, and biodiversity impact. But trying to do everything with one platform often means doing nothing especially well. The smartest approach is to lead with the metric that has the biggest impact for your sector, pick a tool that's purpose-built for that problem, and layer in additional tracking as your program matures.
This is exactly why organizations often combine enterprise-wide carbon accounting platforms with specialized tools like Scrapp for focused waste data and engagement — covering the full picture without compromising depth in any one area.
The top 10 environmental impact tracking tools for 2026
Selecting the right platform means understanding how different tools address different organizational needs — from enterprise-wide carbon accounting to specialized waste tracking.
1. Scrapp
Waste & Circularity
Scrapp is the leading platform for organizations serious about achieving zero-waste goals. Where most environmental platforms treat waste as one line item inside a broader carbon dashboard, Scrapp treats it as the core focus — providing granular, item-level waste data that goes deeper than any generalist tool.
What sets Scrapp apart is the combination of measurement and engagement. The platform doesn't just collect data — it gives you communication tools that drive behavioral change among employees, suppliers, and communities. Organizations using Scrapp report significant improvements in recycling rates and measurable reductions in waste-related costs. And because Scrapp serves businesses, brands, communities, and citizens, it's uniquely positioned to address waste challenges at every level.
Recent launches — including support for 20 languages and a live deployment for 350,000+ Miami-Dade County households — demonstrate the platform's ability to scale from a single office to an entire municipality.

2. Leanpath
Waste & Circularity
Leanpath is the leader in food waste prevention for commercial kitchens and foodservice operations. The platform combines AI-powered tracking hardware — from bench scales to fully touchless floor-scale systems — with analytics that pinpoint the root causes of waste, not just the weight. Clients including Sodexo, Google, and Compass Group use Leanpath to cut food waste by up to 50%. For any organization where food is a significant part of the waste stream, Leanpath is purpose-built for the problem.

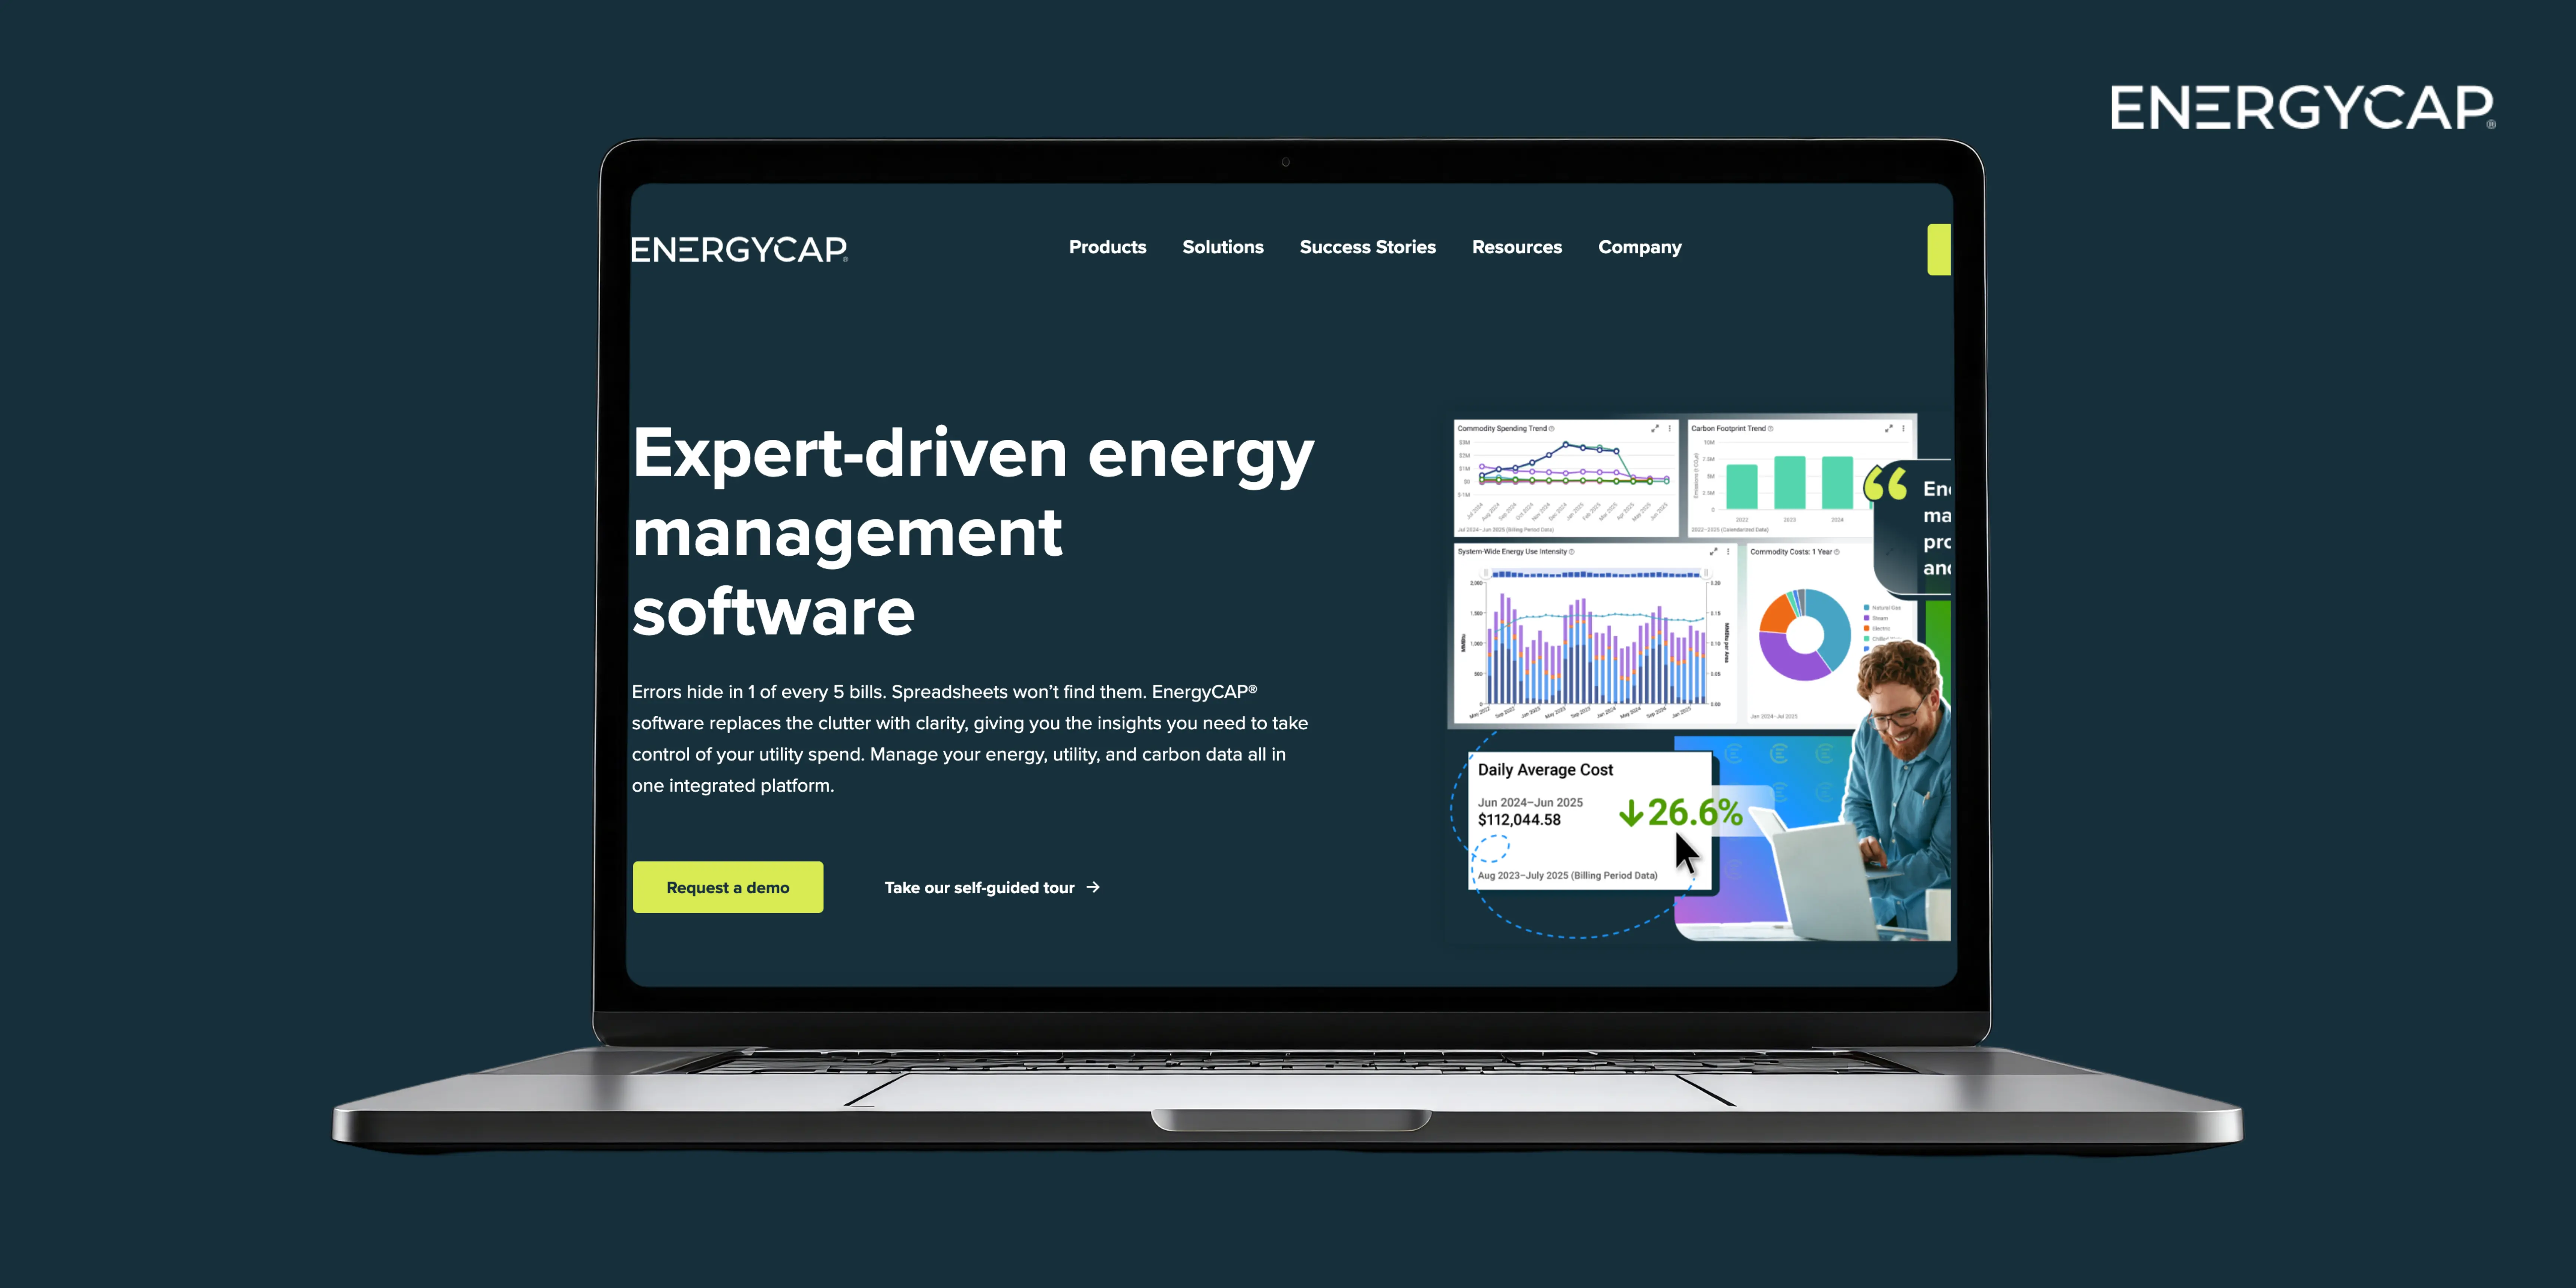
3. EnergyCAP
Energy Consumption
EnergyCAP has been simplifying energy and sustainability data management for over 40 years. The platform automates utility bill processing, tracks interval data from smart meters, and uses AI-driven anomaly detection to flag consumption spikes before they hit your budget. It's particularly strong for organizations managing energy across large building portfolios — universities, facility managers, and commercial real estate teams. If energy consumption is your biggest cost (and carbon) driver, EnergyCAP delivers clear ROI.
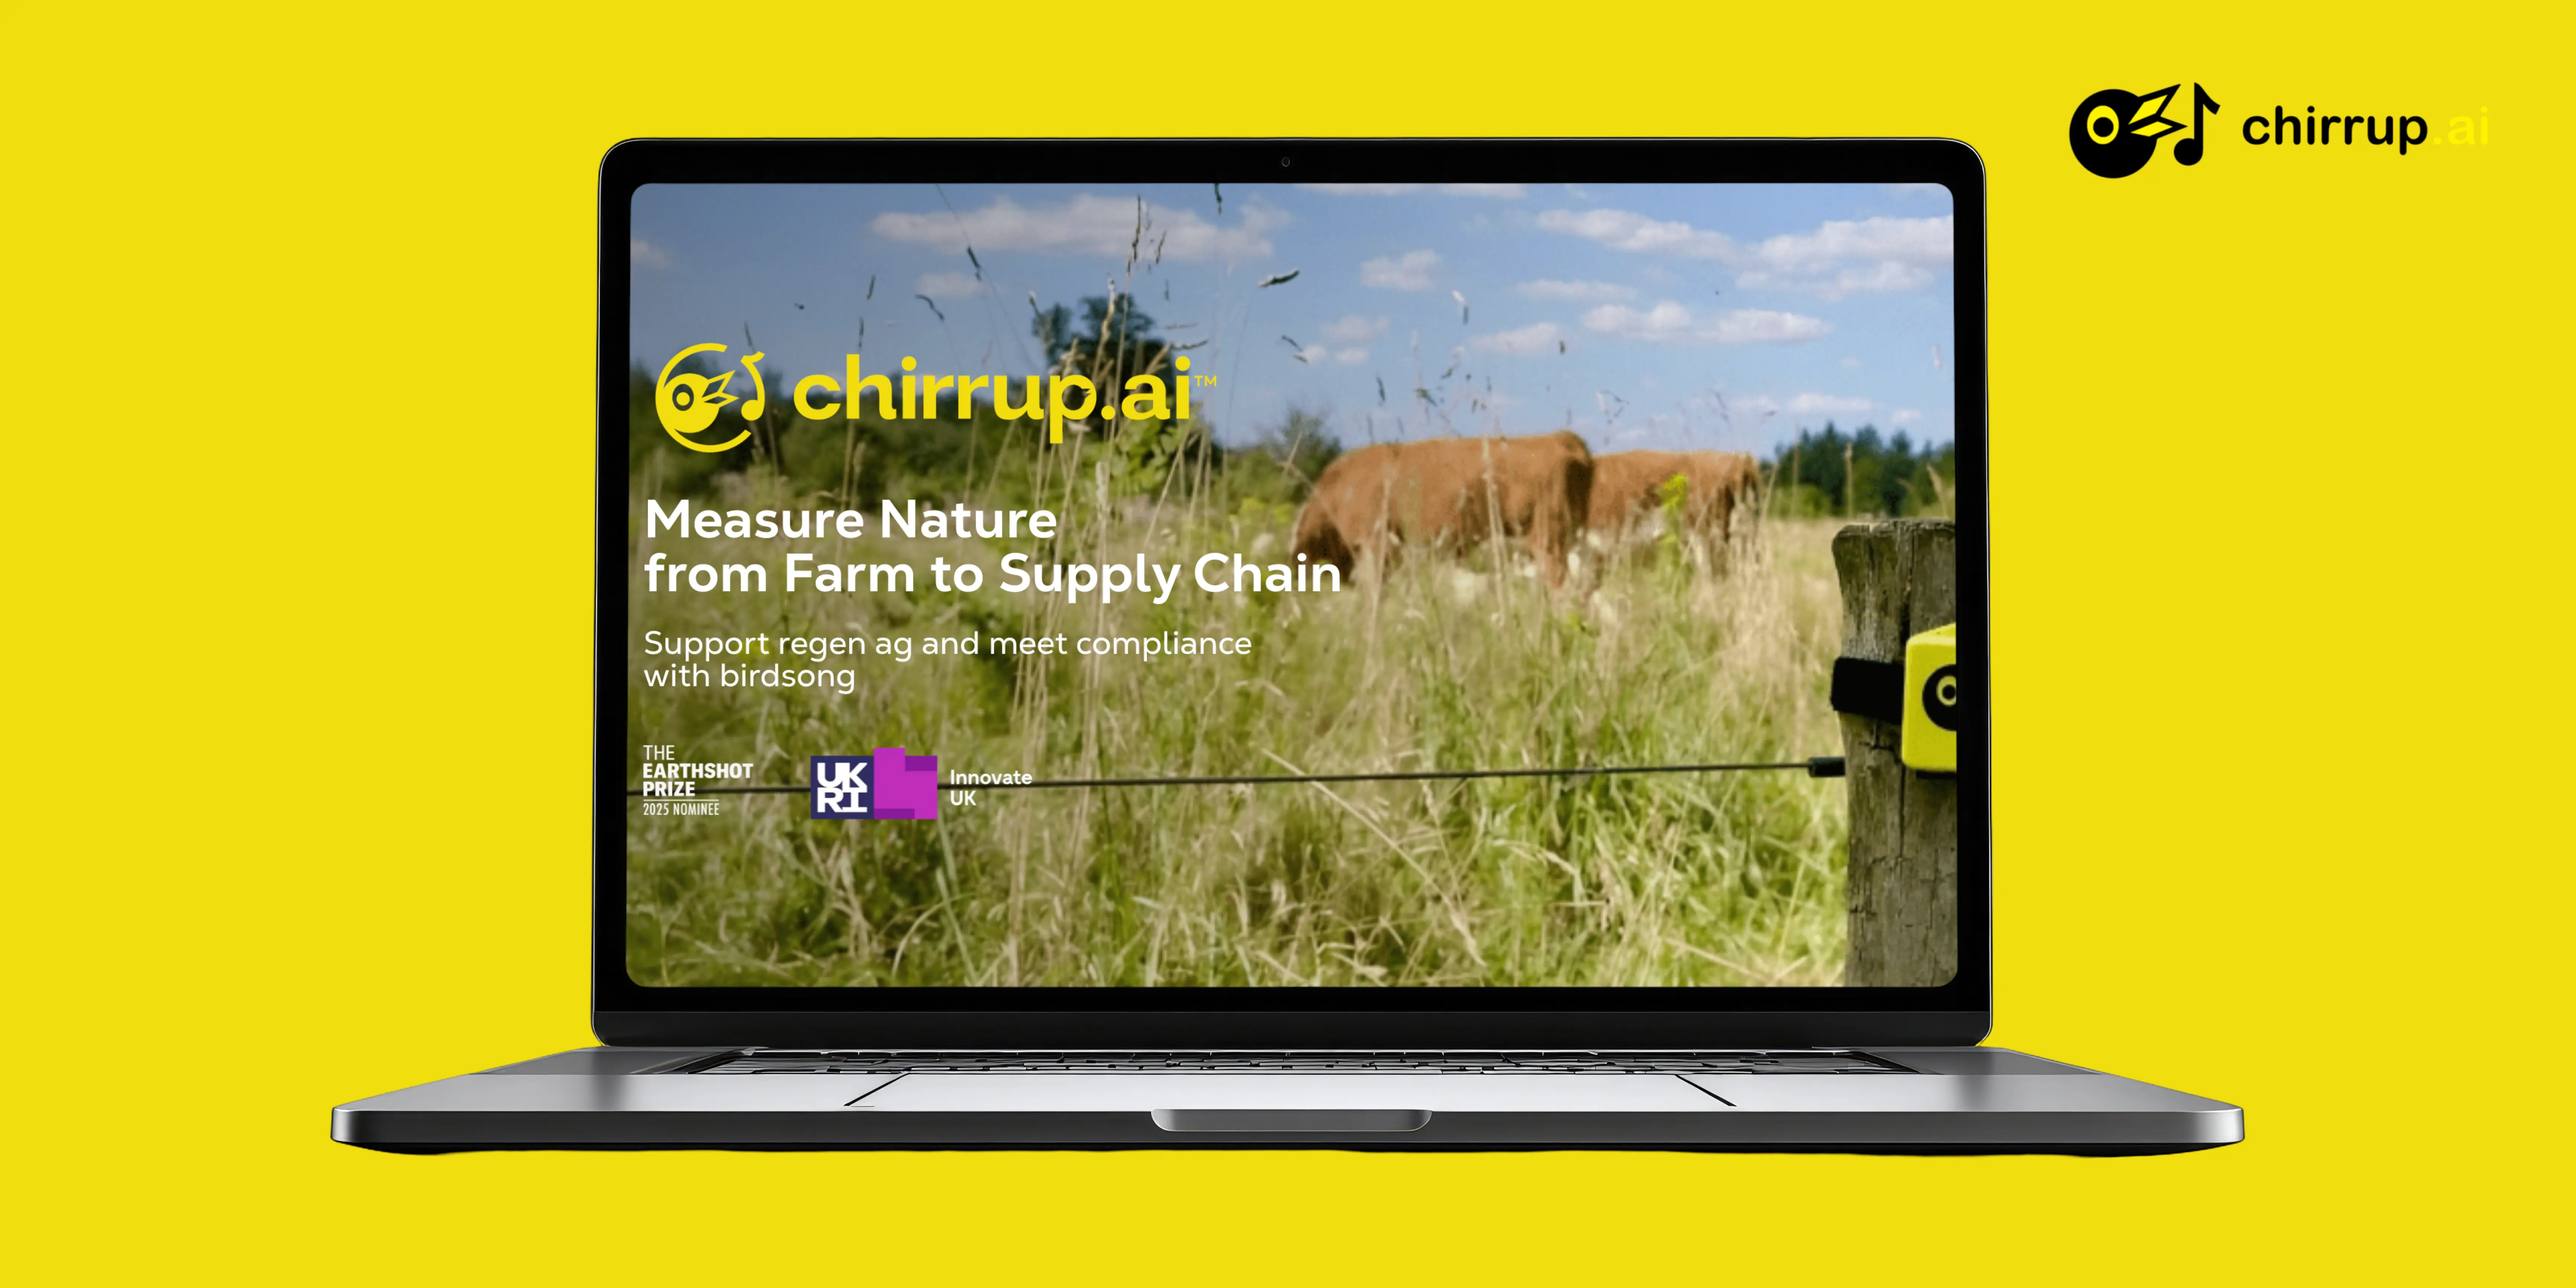
4. Chirrup AI
Biodiversity
Chirrup AI takes a refreshingly different approach to environmental monitoring: it listens to birdsong. Using bio-acoustic technology and AI, the platform identifies bird species across farmland and rural landscapes, turning that data into standardized biodiversity scores and reports. Since birds are strong indicators of overall ecosystem health — from soil quality to insect populations — the approach provides scalable, science-based biodiversity monitoring without complex setup or ongoing maintenance. Chirrup already works with over 700 farms and won the 2025 Business Green Award for Nature.
5. Persefoni
Carbon Emissions
Persefoni focuses specifically on carbon accounting with a platform built for emerging regulatory disclosure requirements. Its strength is producing audit-ready emissions calculations across Scope 1, 2, and 3 that satisfy the most demanding stakeholder expectations. For organizations where carbon is the primary metric — airlines, energy companies, heavy industry — Persefoni delivers the depth and rigor needed.

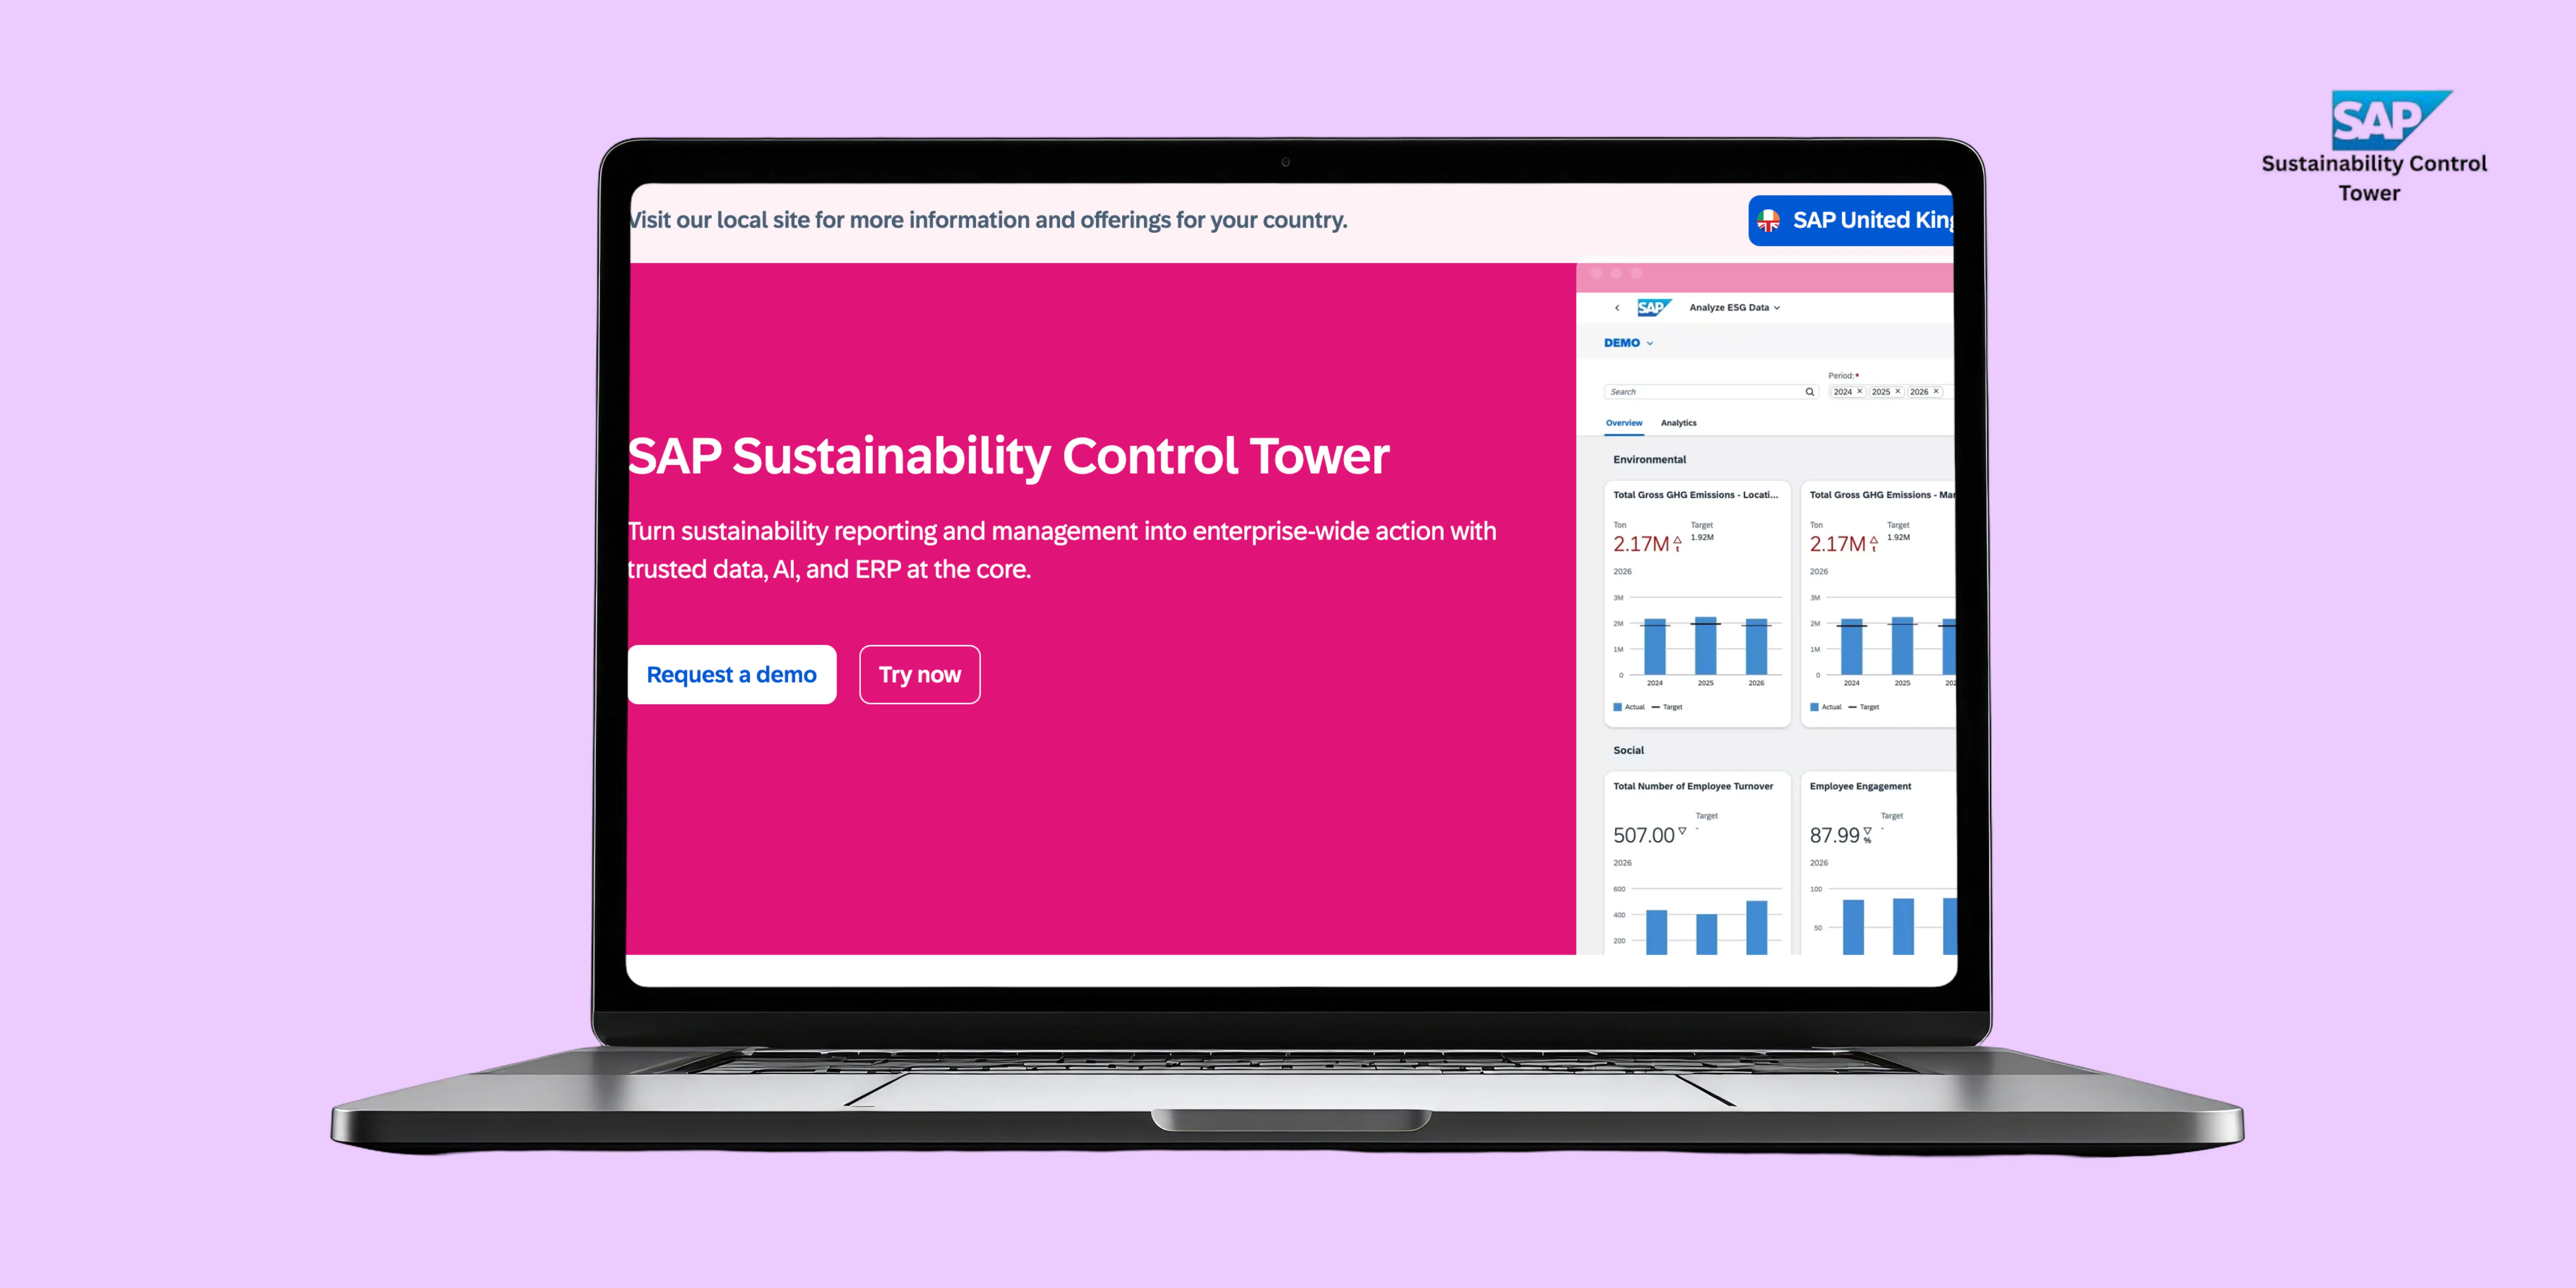
6. SAP Sustainability Control Tower
Carbon Emissions, Waste & Circularity, Water Consumption, Energy Consumption
SAP offers enterprise-grade environmental tracking for large organizations already invested in SAP infrastructure. The platform integrates environmental data — emissions, waste, water, energy — with financial and operational systems, connecting performance to business outcomes. Its strength is handling the complexity of multinational operations with diverse supplier bases across multiple metrics simultaneously.
7. NatureMetrics
Biodiversity
NatureMetrics provides biodiversity monitoring powered by environmental DNA (eDNA) — analyzing water and soil samples to detect which species are present across a site or supply chain. The platform serves over 600 companies in 110 countries and aligns with the TNFD framework for nature-related financial disclosures. For organizations with land-intensive or water-dependent supply chains, NatureMetrics provides the ground-truthed biodiversity data that satellite imagery alone can't deliver.
8. Watershed
Carbon Emissions
Watershed has gained traction among technology companies with a user-friendly interface and strong integrations. The platform emphasizes carbon accounting and offsets management, making it a strong entry point for organizations beginning their carbon tracking journey and wanting to move quickly.
9. Sphera
Carbon Emissions, Water Consumption, Waste & Circularity
Sphera offers deep expertise in environmental health and safety (EHS) alongside supply chain sustainability tracking. The platform is particularly strong for manufacturing industries with complex material flows, hazardous waste requirements, and multi-site regulatory obligations — covering waste streams, water discharge, and emissions in one integrated system. For organizations where environmental compliance and operational risk sit side by side, Sphera brings both together.
10. One Click LCA
Carbon Emissions
One Click LCA specializes in construction and building materials, with life cycle assessment capabilities tailored to that industry. The platform also includes a Biodiversity Supply Chain Stress Tool aligned with the TNFD framework, making it one of the few construction-focused tools that addresses both embodied carbon and nature impact. Organizations in real estate and infrastructure find its specialized databases particularly valuable.

How these tools work together
What stands out across this list is that no single platform covers every environmental metric equally well. The carbon specialists (Persefoni, Watershed) go deep on emissions. The waste specialists (Scrapp, Leanpath) go deep on diversion and behavioral change. The biodiversity tools (Chirrup AI, NatureMetrics) provide nature data that generalist platforms simply can't. And the energy platforms (EnergyCAP) deliver the granular consumption insights that drive immediate cost savings.
The most effective organizations combine tools — using an enterprise platform like SAP for cross-metric visibility, specialized tools like Scrapp for waste data and engagement, and emerging tools like Chirrup AI for biodiversity. The key is matching each tool to the problem it was built to solve.
Core capabilities that separate the best from the rest
Effective tracking platforms go beyond basic compliance reporting. Here's what the best ones offer.
- Data collection and integration is the foundation. The most effective platforms pull from IoT sensors, supplier surveys, procurement systems, and third-party databases — then standardize everything into comparable formats with audit trails that satisfy regulators.
- Supplier engagement tools turn passive reporting into active improvement. Effective platforms assess supplier environmental performance, set collaborative targets, and make it easy for suppliers of all sizes to participate.
- Reporting and disclosure must satisfy multiple stakeholders simultaneously. That means outputs formatted for GRI, CDP, SASB, ISSB, and TNFD standards, alongside regulatory submissions and investor presentations.
- Predictive analytics represent the frontier. Advanced platforms use historical data to forecast future impacts, model different supplier choices, and identify which interventions deliver the best results per dollar invested.
- Real-time alerting enables proactive management rather than reactive reporting. Continuous monitoring flags when waste levels exceed thresholds, emissions spike, or suppliers miss targets — preventing 20–40% of potential environmental incidents through early detection.
Myths that hold organizations back
"Environmental tracking is just about compliance."
Organizations that treat tracking as box-checking miss the operational improvements and cost savings that come with genuine environmental visibility. The best programs inform decisions about supplier selection, product design, and operational efficiency.
"Accurate tracking requires massive infrastructure investment."
Effective tracking often starts with data you already have — procurement records, shipping documents, supplier information. The real task is turning scattered data into actionable insights.
"Small suppliers can't participate."
Modern platforms with mobile-first interfaces and simplified data entry make it easy for suppliers of all sizes to contribute. Many suppliers welcome the chance to demonstrate their environmental credentials.
"Scope 3 is unmeasurable."
Industry-specific emission factors, supplier surveys, and spend-based calculations provide increasingly accurate estimates. Perfect measurement shouldn't be the enemy of good measurement.
"Only large corporations benefit."
Small and mid-sized businesses often see faster ROI because they can implement changes more quickly. Tracking reveals inefficiencies that simply aren't visible without systematic measurement.
Where to start
The journey toward comprehensive supply chain environmental tracking doesn't have to be overwhelming. Start by identifying where your biggest impact sits — emissions, waste, water, energy, or biodiversity — and pick a tool that's built for that challenge.
If waste reduction and circularity are a priority for your organization, Scrapp can help. We've built a platform that gives you the waste data you need to cut costs, prove compliance, and make measurable progress toward zero-waste — without the spreadsheet chaos.